Another multi-pane page.
Needs Assessment
Shows total counts of students in categories like Never Taken Star Math, Needs Star Math this window, No Learning Profile, etc. . Clicking a category opens an accordion to view each student in said category. Buttons to Export CSC (works) and Copy Emails (doesn’t work, students do not have emails on file).
Under communicated students
Lists all students who have received fewer than the median number of reports over the last 12 weeks (time range is not configurable). Lists the academy average number of reports per student.
Clicking a student name opens their SIS page (should it open a report writer, discovery: the ability to create and read reports is inside the SIS page)? Has the same Copy Emails and Export CSV buttons as the Needs Assessment pane. For each student, lists number of reports in the last 12 weeks, % of average, and status (likely forgotten joined 2 weeks ago, etc.)
Key Indicators
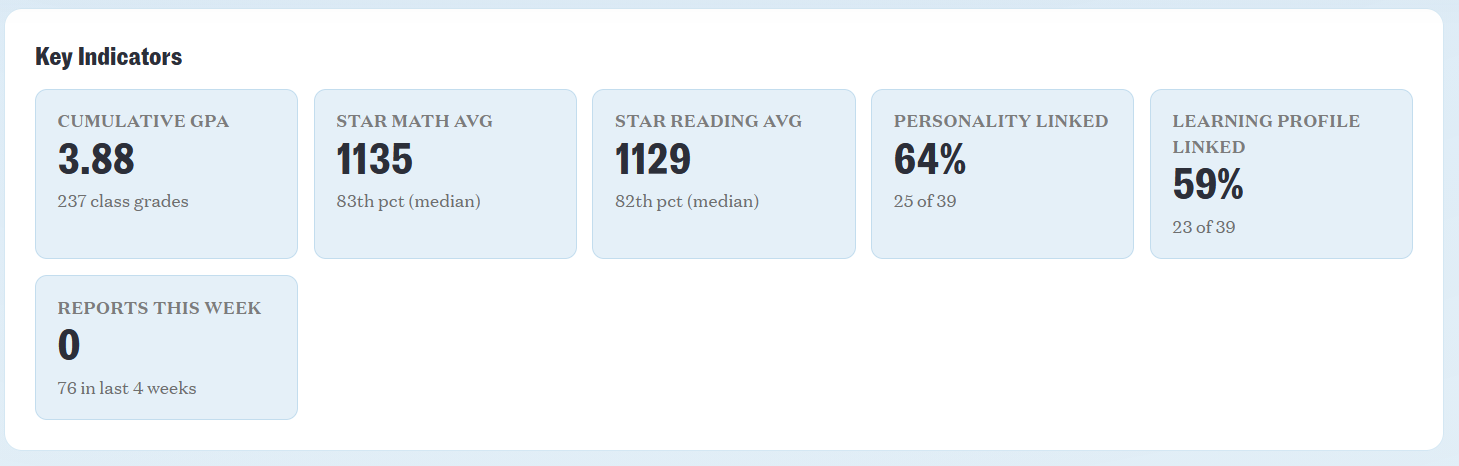
Cards-based UI showing aggregate stats. Cards cannot be clicked through. Stats include:
Star Window Compliance
Shows the most recent 4 quarts, what fraction and what percent of students took Star Math and Star Reading during those quarters. Clicking a quarter shows a list of students who missed the assessment. Option to export CSVs.
Per Window Compliance Matrix
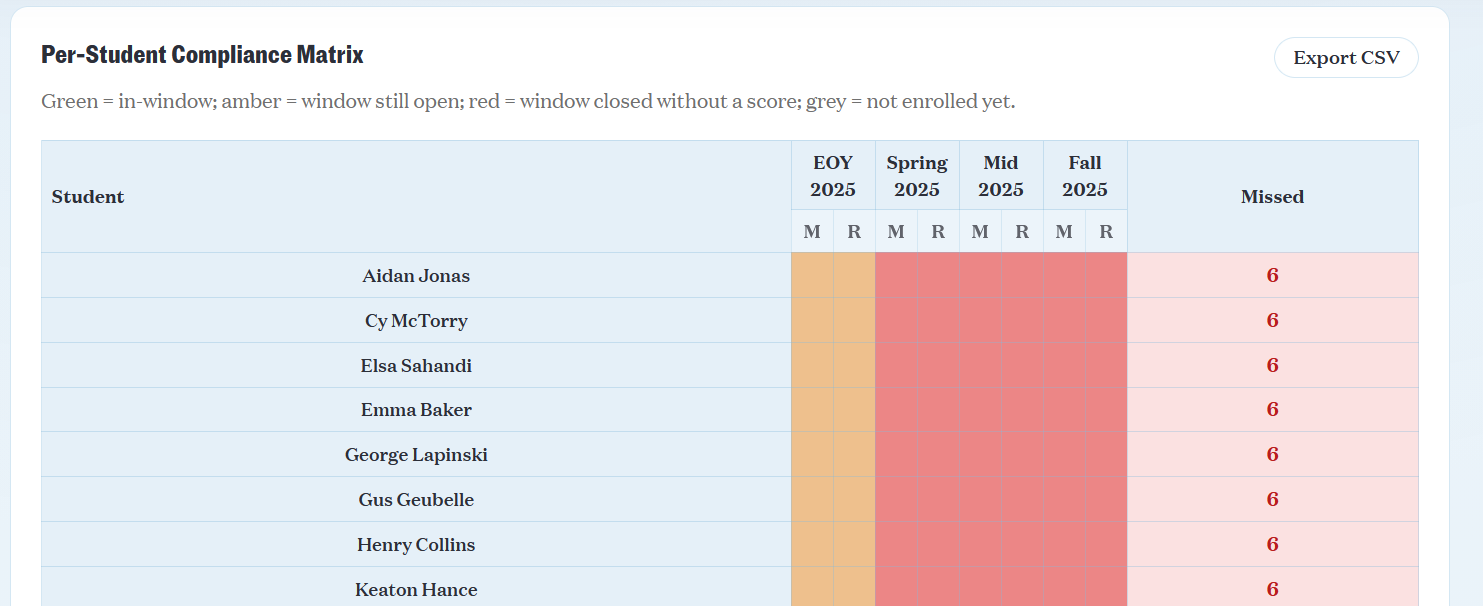
Graph. Y-axis — every student X-axis — every Star Test last four quarters
Legend and Color coding difficult to read.
Graph also displays total count of missed assessments per student.
Option to export as CSV.
What happens as student count grows and this graph gets harder to read? Bare minimum: lock the top column headers and allow an internal scroll of the graph instead of scrolling the entire page. Do we want to include students with 0 missed assessments in this graph?
Academy Star Trends
Composite line graphs showing trend lines for every student layered over each other. Lines different colors, but I am red-green colorblind and they all look green.. Hovering over a line shows information about the student, but this hover box is frequently partially off-screen and cannot be read.
Graphs available for: Star Math, Star Reading, with option for Scale Score or Percentile Rank. Should this be part of a separate analytics package with configurable graphs?
GPA by Semester
Single trend line between two data points (Last semester’s aggregate GPA and this semester’s).
Weekly Reports last 12 weeks
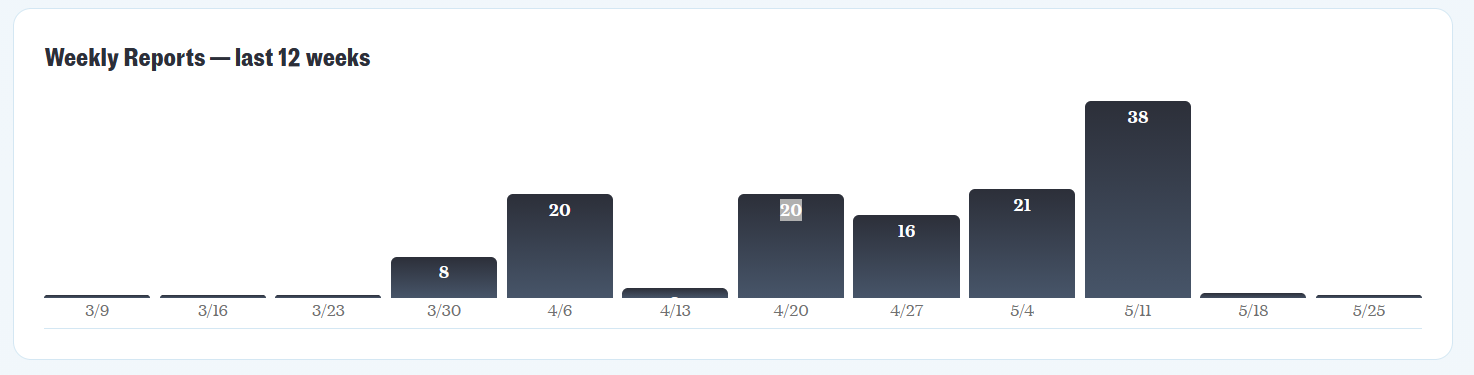
Histogram showing how many reports were sent the last 12 weeks, with a breakdown by week. You cannot click on a week.
GPA Distribution
Histogram showing how many students fall into each GPA band (counting by 0.25). Histogram bars cannot be clicked on.
GPA by Online School
Bar chart breaking down the aggregate average GPAs of each cohort of students enrolled into each online school (ICL Academy, Liberty, etc.)
Weekly Reports — per Teacher
Table showing every teacher in the school and how many reports they sent this week, last 4 weeks, and YTD. Option to export as CSV.
Teachers with 0 reports this week
List by name each teacher who has not submitted a report this week.
Behind — Heatmap (students x last 8 weeks)
Table with a list of every student who had a report submitted for them showing them behind on at least one assignment over the last 8 weeks. Columns show the week. Cell shows how many assignments were marked behind.
You can click on a student name, but not a week or a cell (you cannot see the week's reports, and you cannot see which assignments are behind ^oamg).
Should this graph go in a more specific assignments section? Should any of the graphs and tables in this section or the Academics Dashboard be grouped out into other sections (reports, assignments, etc)?
Assignment Backlog Leaderboard
Lists the students who are farthest behind (by most number of assignments), how many classes they are behind in, raw number of assignments, and when their most recent report was filed.
Users can click through student names, but not classes, assignments, or reports.
Where is this data coming from? How do teachers view a students report? How do they file a report ^tzbtt?