This page is split into multiple panes.
Cumulative GPA This pane shows the school’s average gpa, the total counts of students with a GPA in each grade-band, and then lists every student and their GPA, with an ascending sort ordered by GPA.
Online School Enrollment This pane uses horizontal bar graphs to show the total student counts for every online school. “Not receiving F&F academic support” is listed as a school. Clicking on a school highlights it. If you then scroll down below the bar graphs, you see a list of all students enrolled in that school. This UI behavior is non-obvious. Inside of this list, an admin can either change the school or click a student’s name to open their Full Time Academy SIS page (academics section).
Star Math Trends this pane shows the deltas between the two most recent Star math assessments. Aggregate stats show the total student counts for the categories Improved, No Change, Declined, and 1 Assessment. Below the aggregate states are lists of each student under the “needs attention” and “improved” sections, as well as a that student’s delta. Click a student name opens their SIS page.
Star Reading Trends Same behavior as the Star math trends pane, but for reading data.
Star Math — Percentile Standing Shows total student count within four percentile bands: Advanced (75+), On Track (50 to 74), Below Average (25 to 49), and Urgent (Below 25). Clicking on a percentile band shows a list of students within the band and their individual percentile score.
Star Reading — Percentile Standing Same as the math pane, but with reading data.
Students not yet assessed — Lists which students have not yet taken the Star Math assessment and/or the Star Reading Assessment.
Assessment Profiles: Lists how many students have been assessed for personality type and learning style, and not assessed. Clicking a name takes you to the students’ SIS page. Scrolling down within this page, there are links Google Docs with the assessment data. It is unclear if/how this data is secured.
Grade Distribution by Class shows every single class in which F&F students are enrolled, the total number of students in that class, and the total number of each letter grade those students have earned.
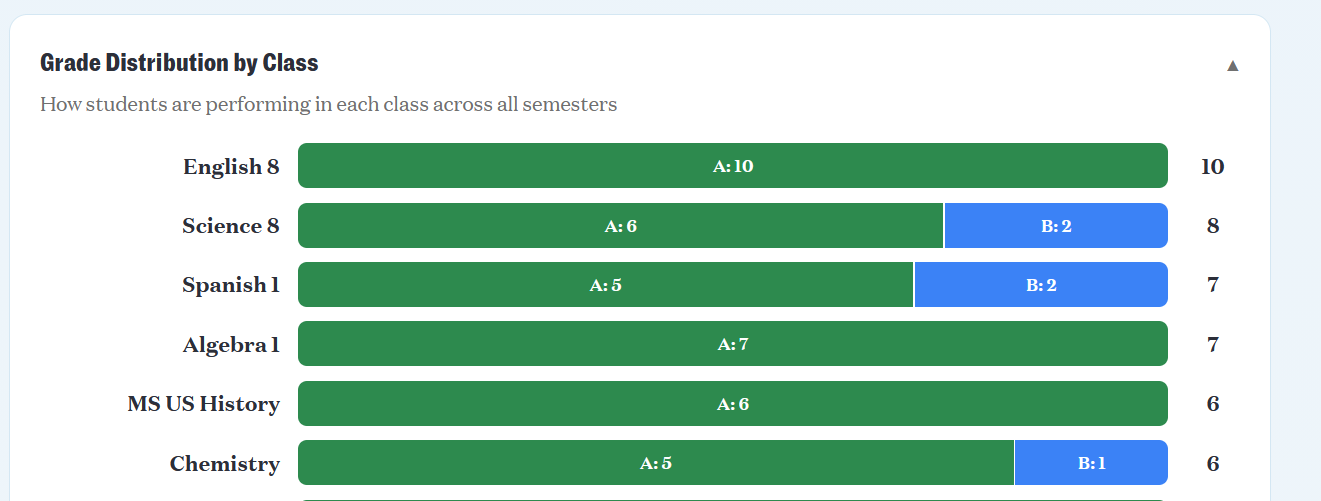
Issues: Is this the best way to visualize this data? Is this the best place to view it? Should these stats be split apart into separate pages, or just a different layout for this page?